Bitcoin has undergone a drop since peaking at $14,100 on Saturday. On Monday morning, the leading cryptocurrency fell as low as $13,200, marking a 6.5% drop from the highs.
Bitcoin has since bounced to $13,700 as of this article’s writing. While the cryptocurrency remains below the $14,000 technical resistance, analysts remain optimistic about the digital asset.
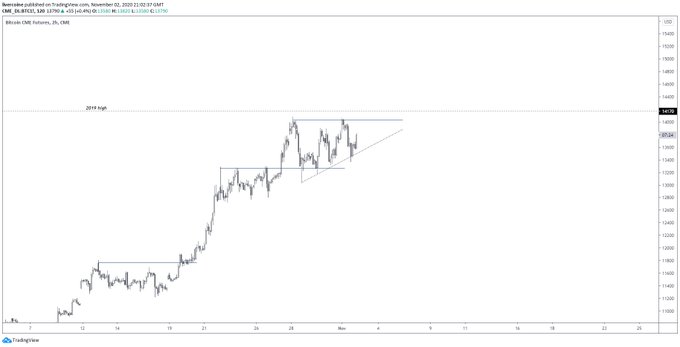
One crypto-asset analyst recently noted that the CME futures’ Bitcoin market is currently printing a bullish chart pattern. Should this pattern play out as it does in textbooks, the asset should move higher in the weeks ahead.
Related Reading: Here’s Why Ethereum’s DeFi Market May Be Near A Bottom
Bitcoin Forms Ascending Triangle Pattern
One crypto-asset analyst recently pointed out that while Bitcoin has faced a drop, it remains in the midst of a bullish ascending triangle pattern. “CME kind wants to pop,” the analyst wrote in reference to the chart below, which shows this pattern playing out.
The pattern that Bitcoin will print a series of higher lows in the coming days, then surge above $14,170 once it turns that level into support.
Chart of BTC's price action over the past few weeks on the CME from crypto trader Livercoin (@Livercoin).
Source:
Related Reading: Tyler Winklevoss: A “Tsunami” of Capital Is Coming For Bitcoin
The Importance of Price Action on the CME
The ascending triangle that has formed on the chart of the CME Bitcoin futures is especially notable as analysts suggest that this market contributes more to price discovery than spot markets.
Wilshire Phoenix a report announcing this finding earlier this month. An excerpt from that report reads:
“Studies on bitcoin price discovery have consistently shown an interrelationship between the prices on the CME futures market and the prices on one or more of the Constituent Exchanges (which form the basis of the USD/BTC spot market) based on the determinants of price discovery and that, in most instances, the CME futures market is the market that leads prices on the Constituent Exchanges… Our results imply that the CME bitcoin futures market generally incorporates new information faster than the spot market (as represented by the Constituent Exchanges). They also imply that market-wide information is likely to be reflected in the futures market first.”
Whether or not Bitcoin responds to this chart pattern, though, remains to be seen.
Related Reading: 3 Bitcoin On-Chain Trends Show a Macro Bull Market Is Brewing
Featured Image from Shutterstock
Price tags: xbtusd, btcusd, btcusdt
Charts from TradingView.com
CME Bitcoin Market Is Trading in Bullish Ascending Triangle Pattern


